Technical Analysis on U.S. Treasury ETF (TLT)
Monday, December 16th, 2024
Trade Plan Below Video
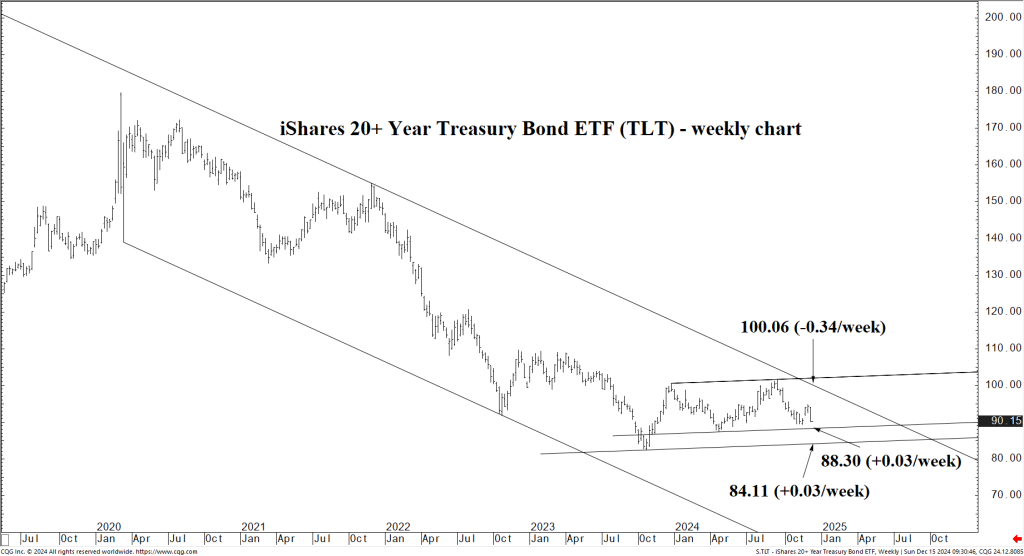
In this Wicked Stocks video analysis, we examine the iShares 20-Year Treasury Bond ETF (TLT), We break down the critical technical levels shaping the TLT trade, including sellable resistance zones and downside price targets, in response to rising long-term interest rates. Watch to learn how to approach TLT in the coming months, with actionable insights for both short and potential long positions.
If you have any questions or suggestions feel free to comment below.
Trade Plan for U.S. Treasury ETF (TLT) for week of December 16th, 2024

Trade Plan for TLT (iShares 20+ Year Treasury Bond ETF)
Current Market Context
- TLT has been in a 4-year bear trend, reflecting rising long-term interest rates.
- Key levels:
- Resistance: $96.66 (short-term) and $100.06 (long-term).
- Support: $88.30 (primary) and $84.11 (secondary, long-term floor).
- Price action suggests potential for continued downside but with key opportunities for swing trades near these levels.
Bullish Setup (Expecting Bond Price Rally)
Entry Point:
- Enter long near $88.30, which is the lower channel support and a viable base through Q1 2025.
- If the price approaches $84.11, consider adding to the position as this represents the long-term floor.
Profit Target:
- Initial target: $96.66, the former channel bottom, now resistance.
- Secondary target: $100.06, the long-term resistance and channel top.
Stop Loss:
- Place a stop loss below $84.00, as a break here signals further downside.
Risk Management:
- Use a position size that limits total loss to 2-3% of your trading capital if stop-loss is triggered.
Bearish Setup (Expecting Bond Price Decline)
Entry Point:
- Short positions near $96.66 resistance or on a rally toward $100.06.
- Wait for a rejection or confirmation of resistance to ensure a high-probability entry.
Profit Target:
- Initial target: $88.30, the lower channel support.
- Secondary target: $84.11, the long-term floor.
Stop Loss:
- Place a stop loss above $100.50, allowing for slight deviations beyond resistance.
Risk Management:
- Limit risk to no more than 3% of your portfolio by adjusting position size appropriately.
Key Scenarios to Monitor
- Breakout Above $100.06 (Bullish):
- Signals the end of the bear trend.
- Bonds could rally, implying falling long-term interest rates. Shift to a bullish bias.
- Break Below $84.11 (Bearish):
- Confirms further downside in TLT and a continuation of rising long-term interest rates.
- Be prepared to hold shorts for extended declines below $80.
- Sideways Action Between $88.30 and $96.66:
- Signals indecision. Look for clear breakouts before committing to directional trades.
Additional Notes
- Weekly Updates: Adjust key levels as resistance ($100.06) drops by $0.34 per week and support ($84.11) rises by $0.03 per week.
- Market Sensitivity: Monitor macroeconomic data and Federal Reserve commentary closely, as they will heavily influence TLT's movement.
Join 1,000+ Smart Investors Unlocking Big Opportunities
Get exclusive access to premium stock picks, real-time market insights, and powerful updates that keep you ahead. Starting today, claim our latest high-potential stock picks—absolutely free during your 5-day trial.
Ready to uncover the stocks primed for big gains?


Leave A Comment
You must be <a href="https://wickedstocks.com/wp-login.php?redirect_to=https%3A%2F%2Fwickedstocks.com%2F2024%2F10%2F24%2Fu-s-treasury-etf-tlt-free-analysis-2%2F">logged in</a> to post a comment.